
Resources · Field performance
What V4 did on ten Permian tank batteries in ninety days.
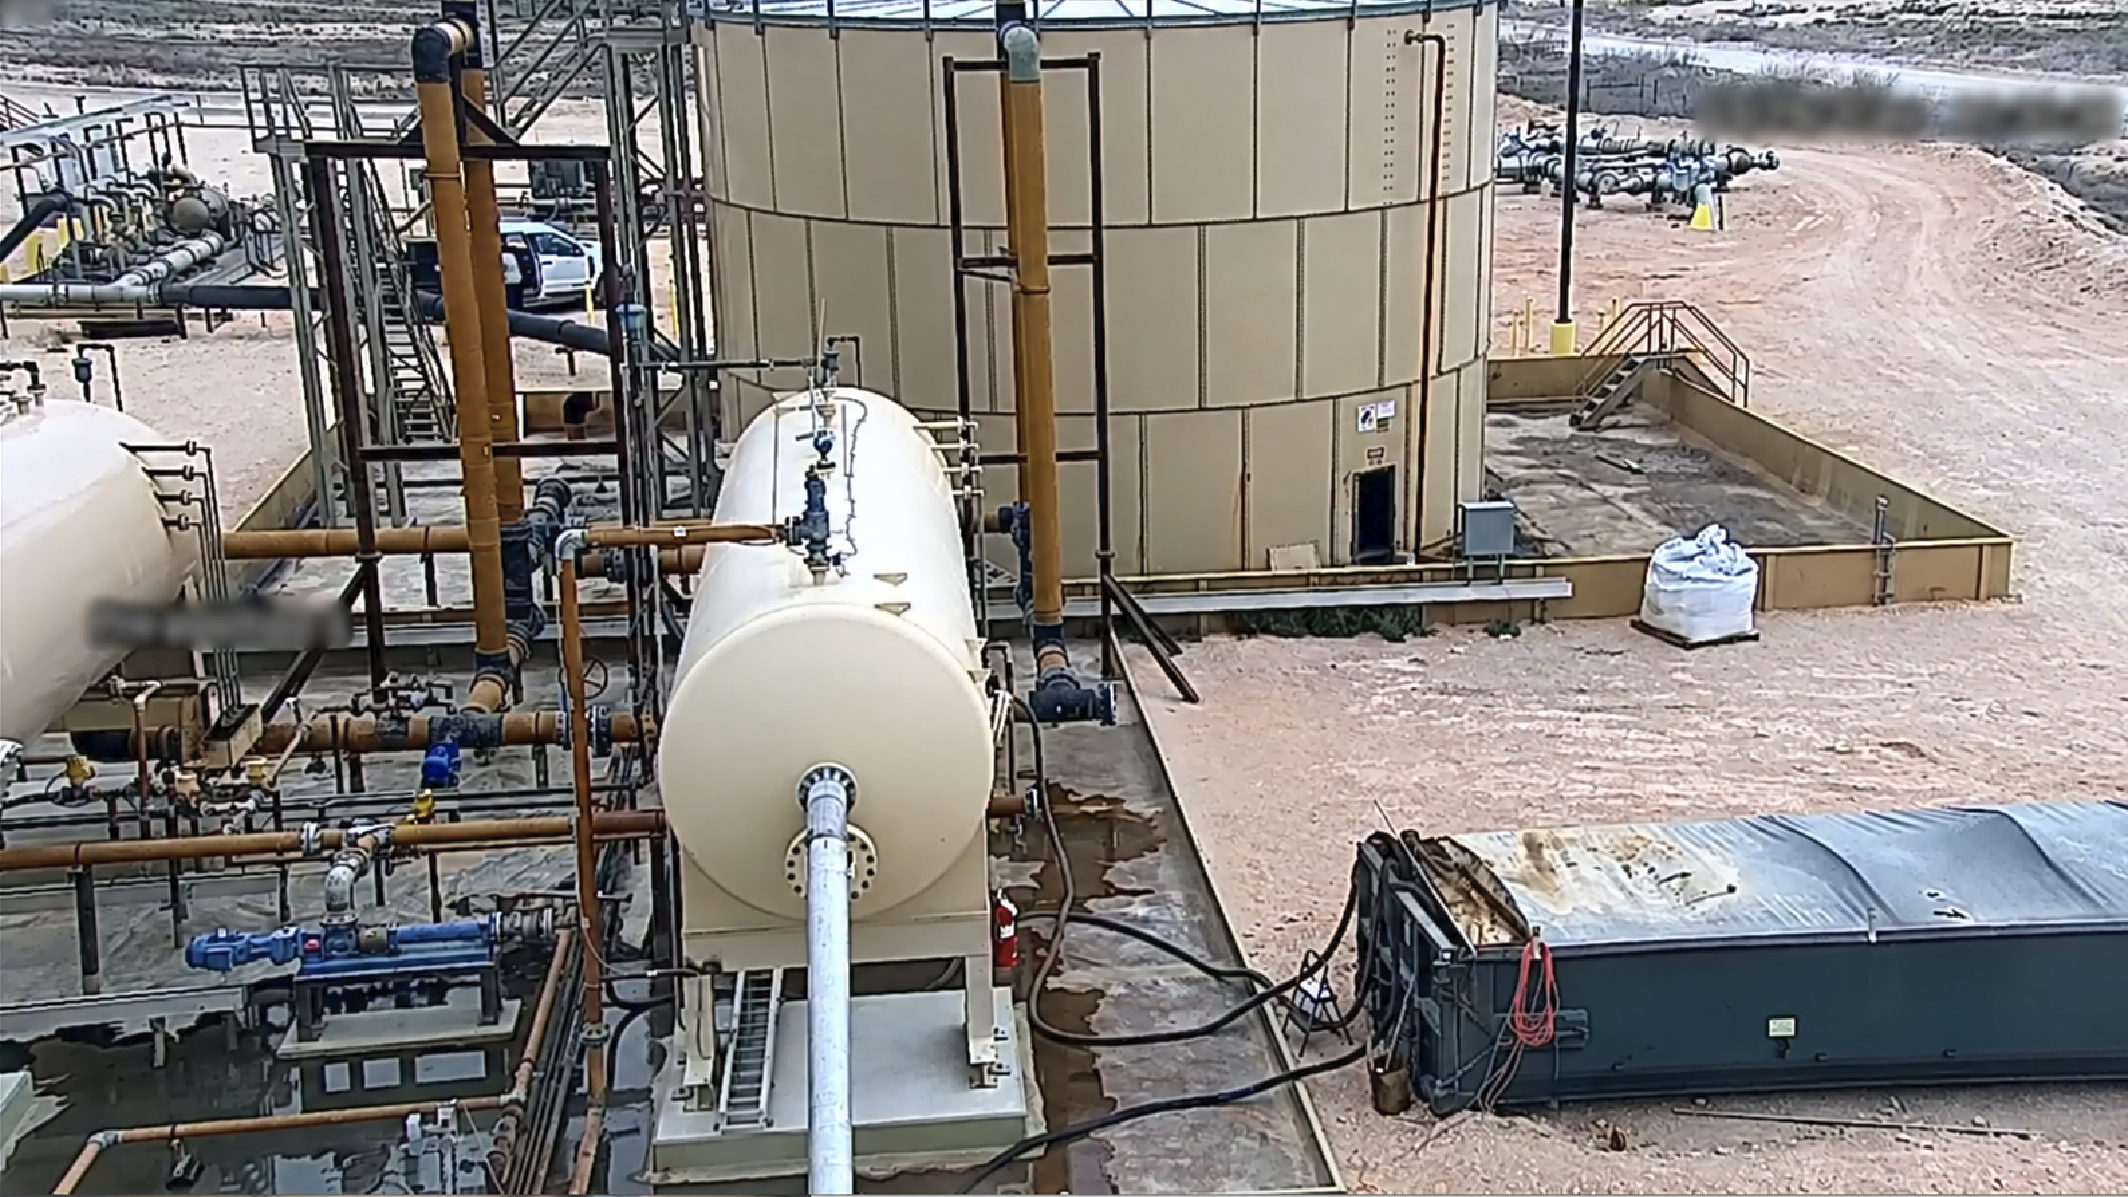
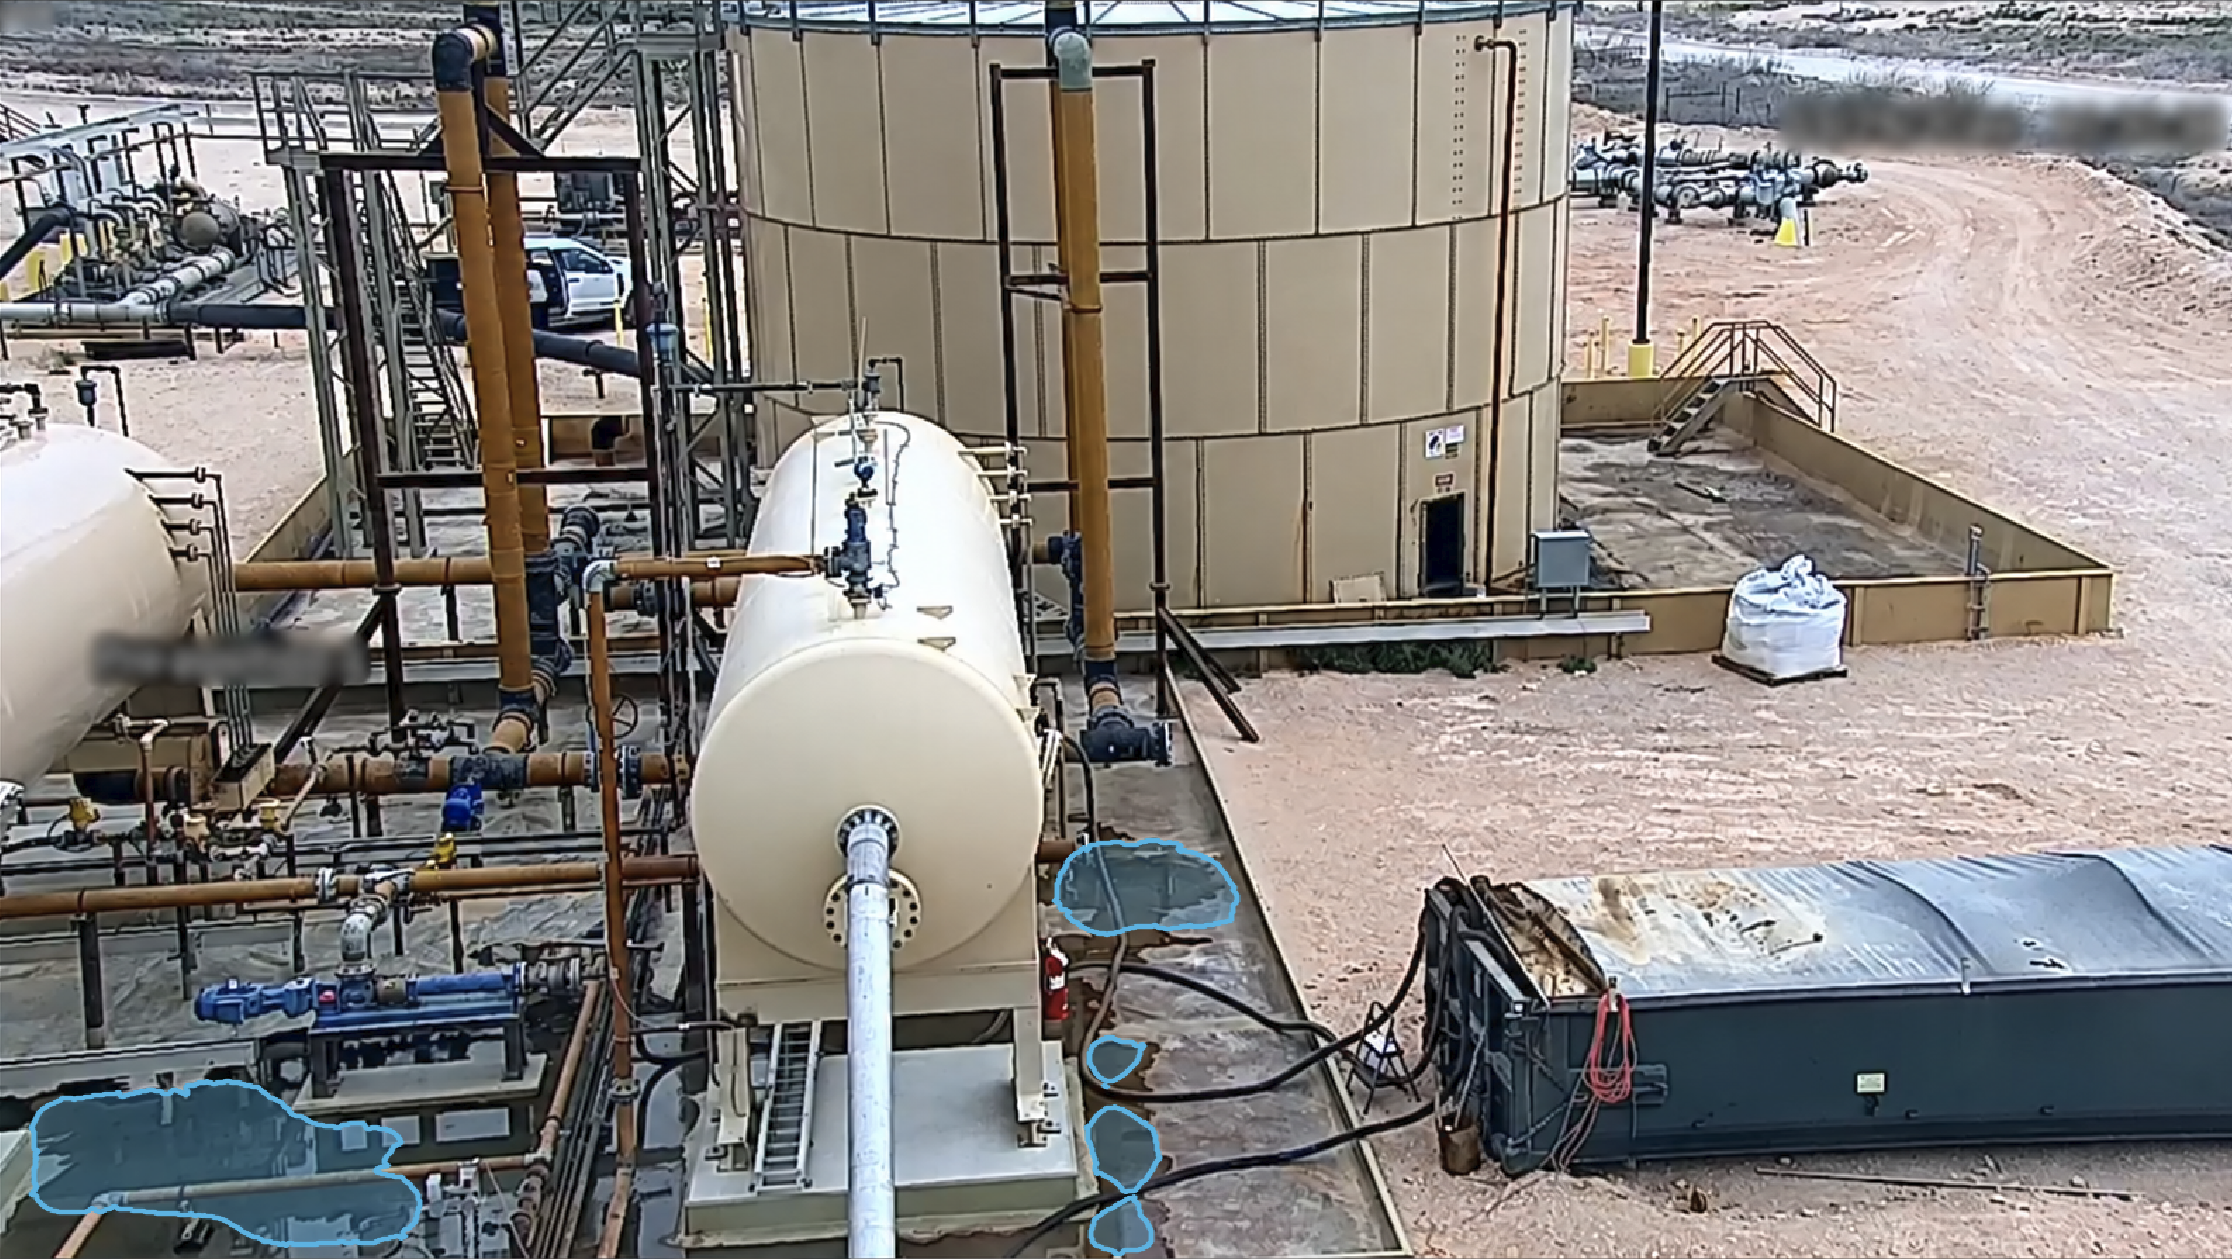
Over a 90-day period in 2026, a pre-release build of VisionAery Liquid Leak Detection V4 watched ten central tank batteries (CTBs) in the Permian Basin through ten PTZ cameras, 900 camera-days in all. It alarmed on every confirmed release that occurred, three in total, each a mixture of crude and produced water, with a median of 23 seconds from the moment the preset brought the leak into view. In dry weather each camera produced one nuisance alarm every 17 days and one false alarm every 41 days.
Software: VisionAery Liquid Leak Detection V4, pre-release build. The same model and alarm engine ship on every V4 platform.
The numbers
Everything below is output from a pre-release V4 build on operating sites, measured after the alarm engine, which is the number an operator lives with. The same model and alarm engine ship on every V4 platform, so these figures are what to expect on-camera or on-server. Frame-level model accuracy is on the benchmark methodology page; this page is what reached the control room.
| Measure | Result | How it was measured |
|---|---|---|
| Period | 90 days, 2026 | Calendar days with the cameras licensed and online |
| Cameras and sites | 10 PTZ cameras, one per site, at 10 central tank batteries in the Permian Basin | Deployment record |
| Camera-days | 900 | 10 cameras × 90 days |
| Confirmed releases | 3, each a mixture of crude and produced water | Hydrocarbons released from containment, confirmed on site, inside an interest zone |
| Alarmed on | All 3 (100%) | Alarm published to the VMS and broker for each confirmed release |
| Time to alarm | Median 23 seconds | From the frame in which the PTZ preset first framed the release to the first published alarm |
| Nuisance alarms, dry periods | One per camera every 17 days (one per 17 camera-days) | Alarms outside rain periods, as classed by the site rain sensor |
| Nuisance alarms, rain periods | One per camera per rain-affected day | Alarms during rain and the 24 hours after it stopped, the span of the post-rain forgiveness window; sites averaged 13 rain-affected days in the period |
| False alarms | One per camera every 41 days (one per 41 camera-days) | Alarms on something the model should not detect: no liquid present |
| Smallest confirmed detection | Imaged at roughly 15 pixels per foot | Pixels per foot on the interest zone at the preset that alarmed |
| Sensitivity setting | High | Detection settings as configured for the period |
| Software | V4, pre-release build | Same model and alarm engine as every shipping V4 platform |
How the terms are used on this page
- Nuisance alarm
- the model detected what it is trained to detect, liquid, but the liquid meant nothing to the operator: rain pooling, wash-down water, a puddle left after a rain event.
- False alarm
- the model detected something it should not have. No liquid was present: a shadow, a stain, a dark patch of ground. This is the field counterpart of the benchmark page's false positive rate.
- Confirmed release
- hydrocarbons released from containment, verified on site.
- Rain period
- from the site rain sensor's first reading of rain until 24 hours after rain stopped, which is the span of V4's post-rain forgiveness window. Everything else is a dry period.
- Camera-day
- one camera, licensed and online, for one calendar day.
Rain
Rain is the condition that defeats most video analytics. The ten sites averaged 13 rain-affected days in the period, each counted from the local rain sensor's first reading until 24 hours after the rain stopped. Inside those periods each camera produced about one nuisance alarm per day; outside them, one every seventeen days. The rain gate holds puddle alarms during rain and through the 24-hour forgiveness window, and spray and vapor detection continue throughout.
What the alarm engine held back
Behind every published alarm are the frames the alarm engine judged and declined. Over the period, V4's staging, persistence, growth-rate and color-confidence tests suppressed 99% of would-be nuisance alarms and 74% of would-be false alarms before anything reached the VMS. The count is of events that met the initial detection criteria and would have been sent as alarms; once an alarm is at stage two or above, the progression logic requires the detection to change in character, by growing, spreading or persisting, before another alarm goes out.
Controlled tests
Real releases are rare, so time to alarm and the smallest detectable release were also measured on planted releases under known conditions.
| Measure | Result |
|---|---|
| Planted releases | 60 runs: three puddles and three sprays at each of the ten sites |
| Fluid and surfaces | Dyed water standing in for crude and produced water, on open ground and on containment liner, day and night |
| Pixels per foot | 25 on average at the detection zone |
| Smallest release to trigger an alarm | Roughly five gallons of fluid, the smallest release that triggered an alarm in the 60 runs |
| Detected | All 60 (100%) |
| Average time to alarm | Under 10 seconds from the start of the release to the published alarm |
| Sensitivity setting | High |
Method
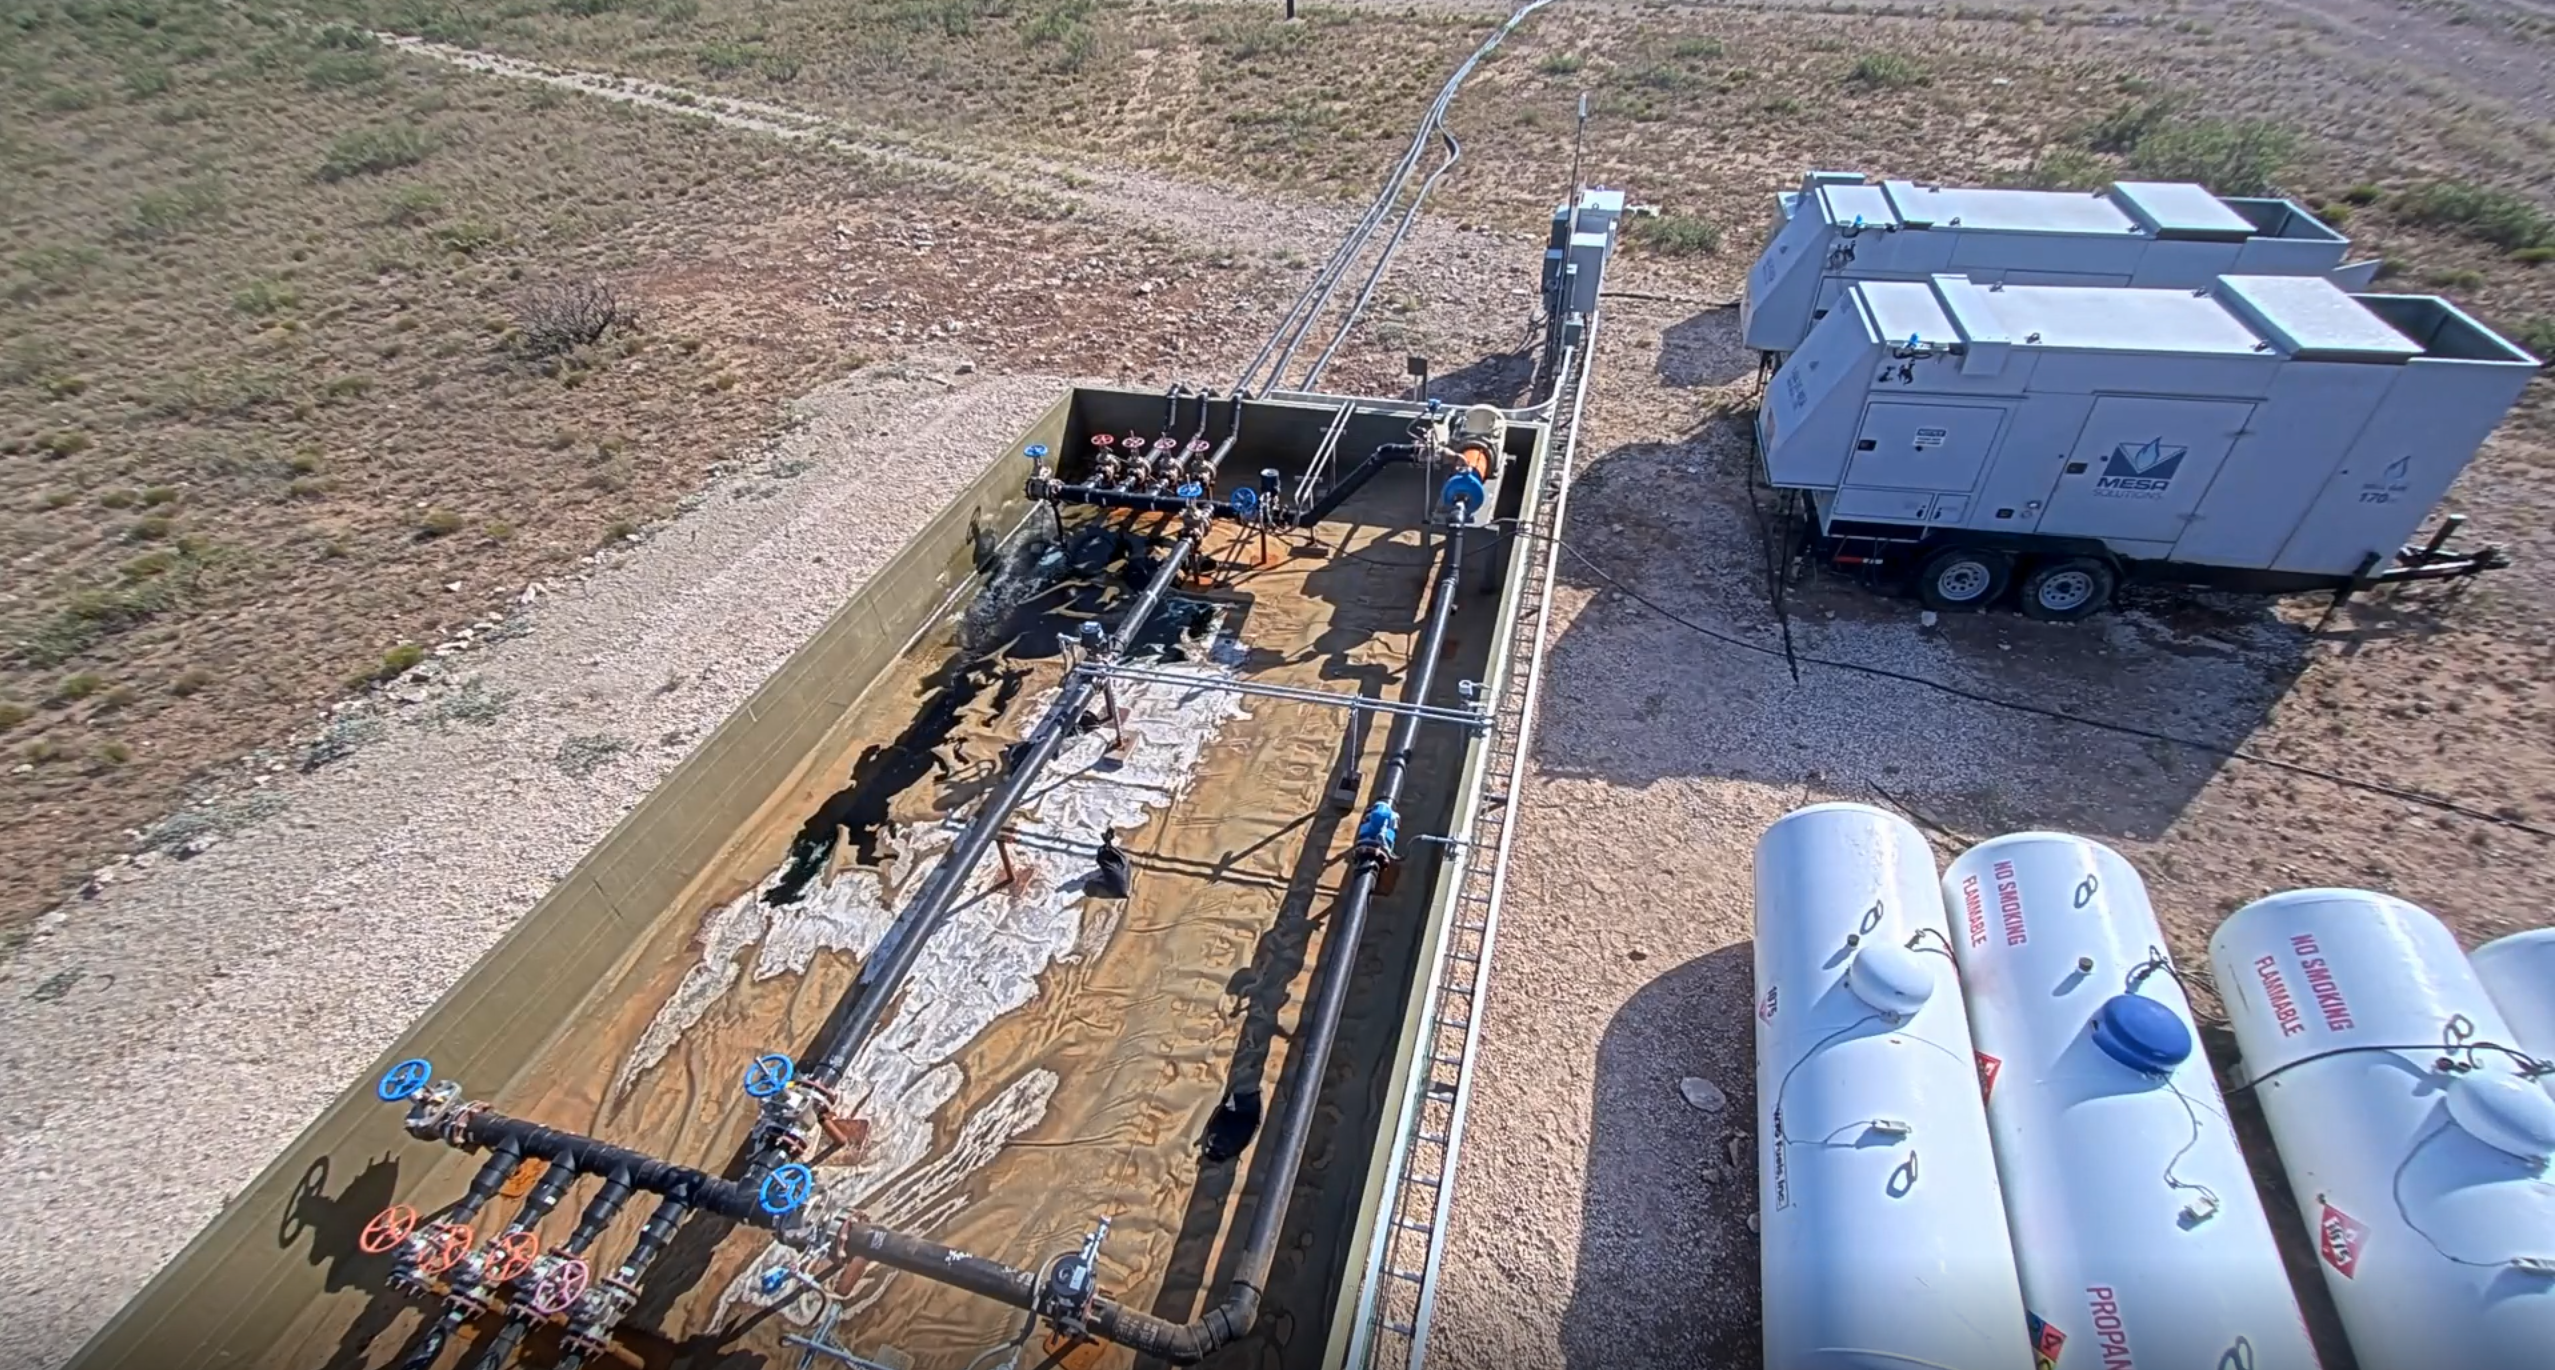
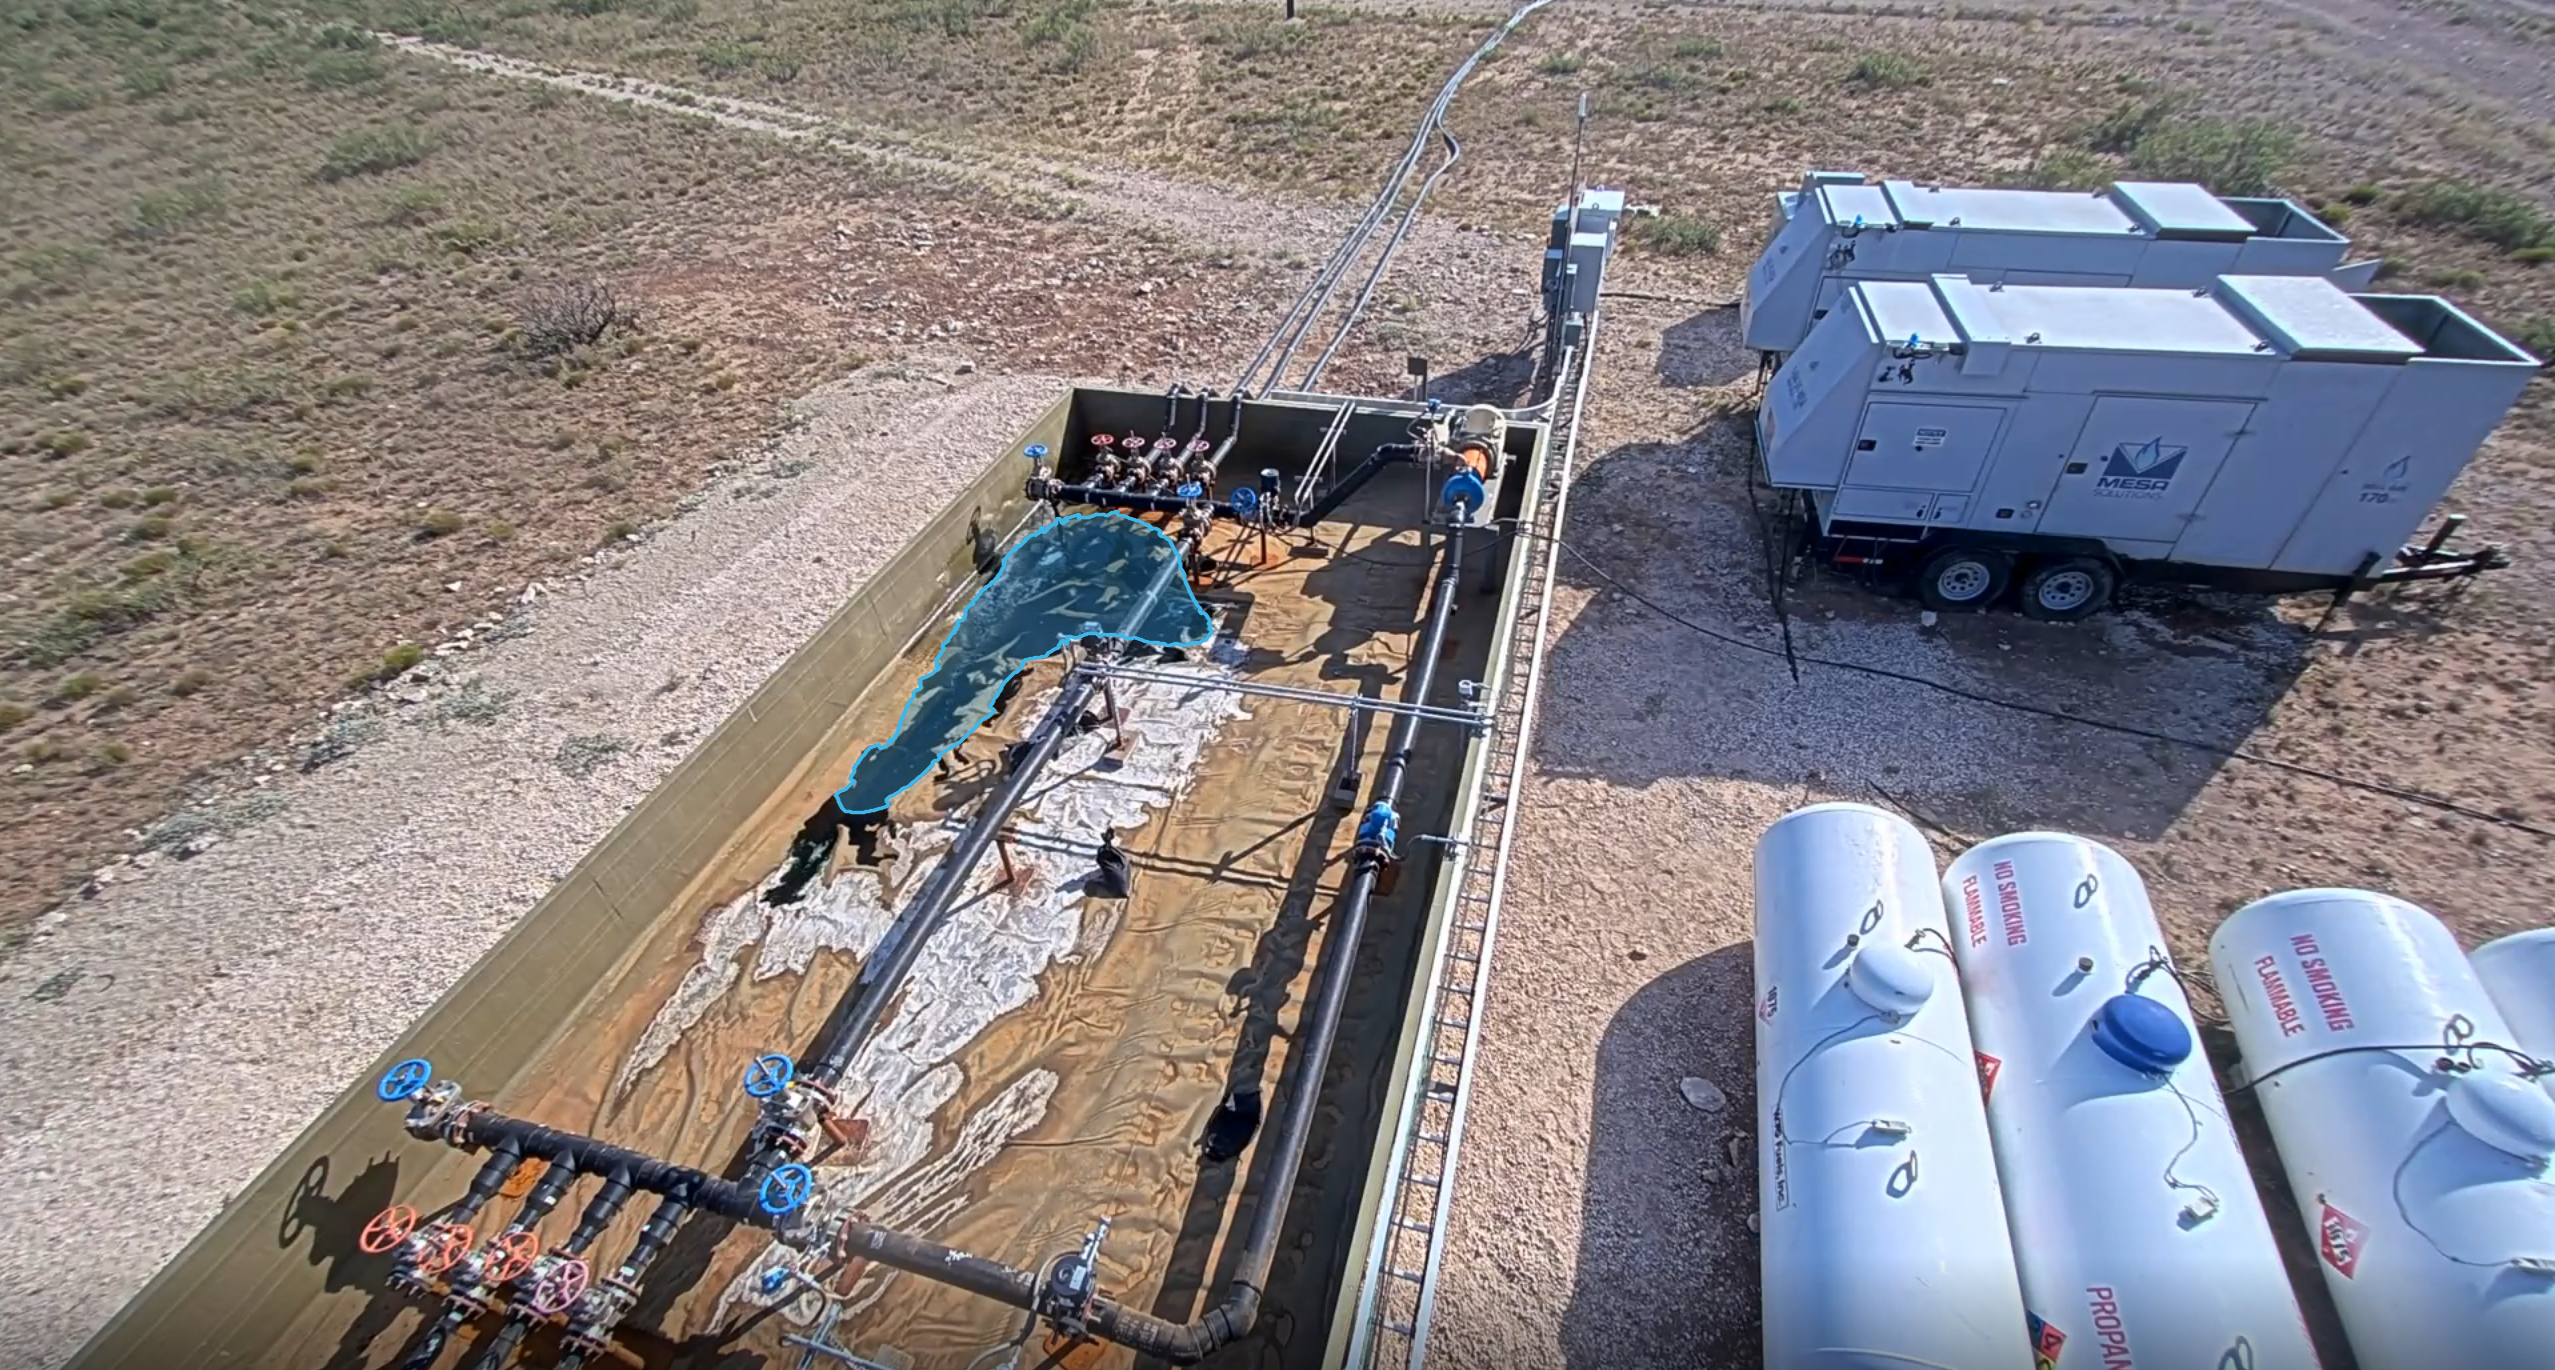
Cameras and coverage. Ten PTZ cameras, one per site, each running a preset tour with interest zones bound to presets. Tours averaged six presets per site with a 60-second dwell at each, so every zone on a site came back into view about every six minutes. A PTZ tour watches one preset at a time, so the time-to-alarm figure is measured from the moment the tour brought the release into view, not from the moment the release began.
Camera-days. Ten cameras × ninety calendar days.
Alarms. Every alarm V4 published to the site's VMS and MQTT broker during the period, with its original and overlay snapshots.
Classification. Each alarm was reviewed against its original and overlay snapshots and the site record, and labelled a confirmed release, a nuisance alarm or a false alarm. A confirmed release means hydrocarbons released from containment, verified on site.
Rain. Rain periods were classed from each site's local rain sensor: from the first reading of rain until 24 hours after it stopped, matching the post-rain forgiveness window. The ten sites averaged 13 rain-affected days.
Time to alarm. From the first frame in which the preset framed the release to the first published alarm stage, read from the snapshot series and VMS timestamps.
Suppression. Events that met the initial detection criteria were counted as would-be alarms. Those the alarm progression held back, because at stage two and above a detection must change in character before another alarm is published, are the suppressed share: 99% of would-be nuisance alarms and 74% of would-be false alarms.
Planted tests. Three puddle runs and three spray runs at each site, 60 in all, using dyed water to stand in for crude and produced water, on open ground and containment liner, by day and by night, at an average of 25 pixels per foot. Time to alarm was measured from the start of the release to the published alarm.
Software and settings. VisionAery Liquid Leak Detection V4, pre-release build, high sensitivity, zones and settings as configured by the site. No per-site training. The model and alarm engine in this build are the ones that ship on every V4 platform.
What this page measures
V4 detects visible liquids, puddle, pressurized spray and visible vapor, inside the interest zones drawn on each camera, on the cameras and over the period listed above. Results on other sites depend on camera placement, pixels on target and zone layout; the camera requirements page covers sizing and the trial page covers how to start measuring the same figures on your own cameras.
Update log
: first publication. 10 cameras, 10 sites, 900 camera-days.